
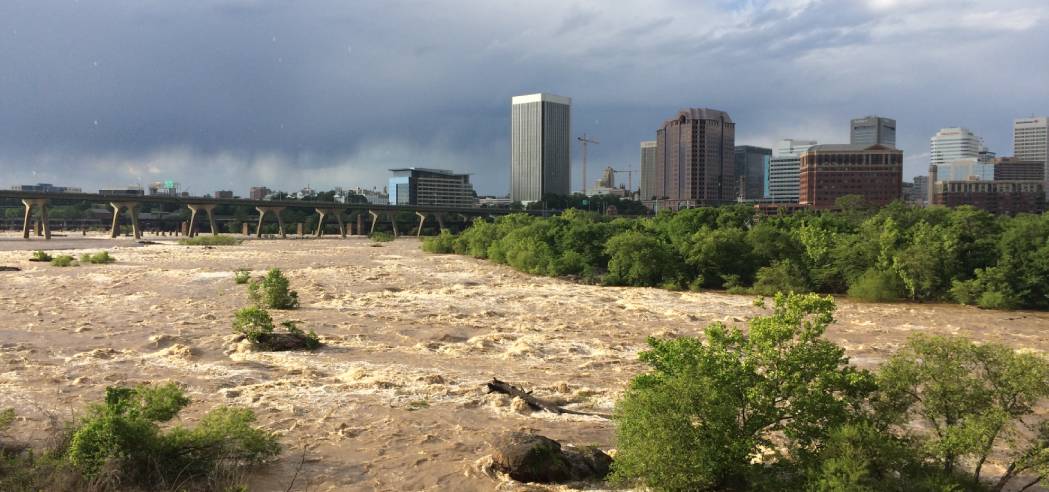
As we kick off 2019 and turn a very soggy page on the past year, it’s worth looking back at one of 2018’s main themes, at least as far as the James River is concerned: the rain.
To state the obvious it’s been wet – I mean unrelentingly, record-settingly wet – across the entire Mid-Atlantic. There are some excellent “2018-in-weather” style recaps from the Richmond Times Dispatch, the Washington Post (see the first hyperlink), and other sources that are definitely worth checking out, but I thought it would be interesting to analyze all this precipitation through a more river-centric lens.
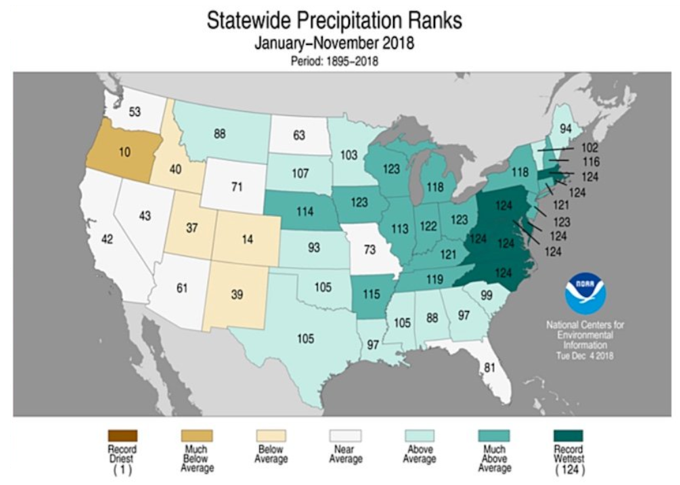
Figure 1. Historical rankings of 2018’s precipitation by state. States labeled “124” experienced their wettest year on record. Data from the National Climatic Data Center are currently unavailable due to a “lapse in appropriations” (read: government shutdown).
All this rainfall has to go somewhere, and with full, waterlogged soils, a higher-than-average proportion of our higher-than average rainfall has coursed down the James and other regional rivers. The extra flow has had a variety of effects, and it may be several months into 2019 – as we begin gathering data for the 2019 State of the James Report – before a clearer picture emerges. For the unfamiliar, the State of the James quantifies the health of the river by analyzing about 20 different indicators, from striped bass to sediment pollution. At this point we can make some tentative guesses (keyword tentative) about how some of these indicators may respond, but before we dive in, let’s examine just how unbelievably wet it’s been.
Figure 1 ranks 2018’s precipitation in increasing order of wetness within a 124-year dataset. States that have experienced their wettest year on record are labeled with a “124”, second-wettest years are labeled with a “123”, and so on. In 2018, Virginia and nearly every state in the Chesapeake Bay watershed experienced their wettest year in 124 years of recordkeeping.
How much rain does this equate to? To answer, take a look at Figure 2. The top panel displays radar-estimated rainfall totals for 2018. We see 60, 70, and even 80″ of rain across large swaths of the watershed – and this despite the fact that the method tends to underestimate rainfall totals in mountainous areas. Montebello State Fish Hatchery in Nelson County led the way, reporting an absolutely incredible 97.34” inches of rain in 2018 – the highest yearly rainfall total ever observed anywhere in Virginia, and almost 14” more than the previous record.
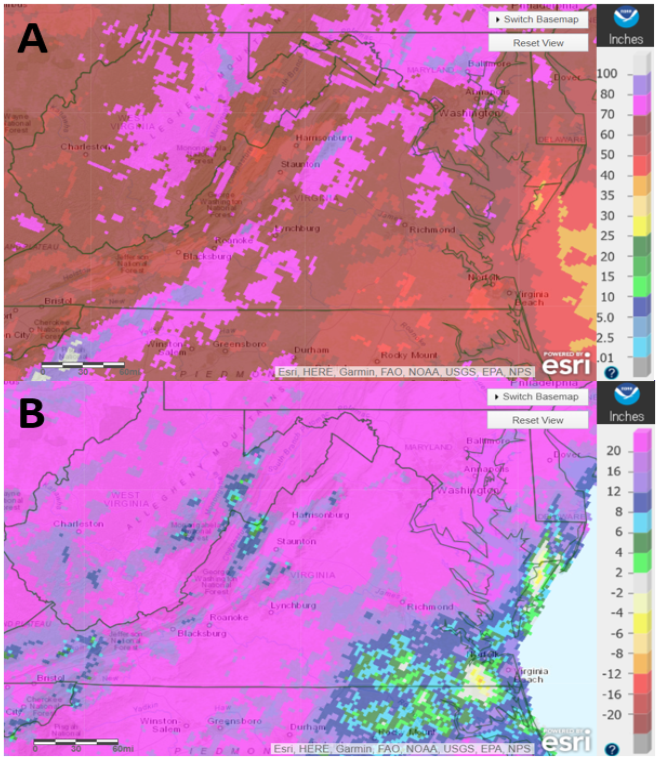
Figure 2. Virginia’s 2018 rainfall totals (Panel A) and departures from average (Panel B), with color scales shown at right. Data from the Advanced Hydrological Prediction Service.
The bottom panel of this figure displays 2018’s rainfall as a departure from average, with the vast majority of Virginia in bright pink – more than 20” above normal. Embedded within this highest category are localized totals that are 25”, 30”, or more above average, but the color scheme was not designed to show such astronomical amounts. Put another way, 2018’s totals have broken the way the National Weather Service visualizes rainfall.
The most intuitive result of extra rainfall is flooding – something for which 2018 has again set records. We’re quite fortunate that in Virginia this year’s rain has been relatively well-distributed, rather than falling all at once in another catastrophic, Harvey- or Florence-like deluge (which are rapidly growing more frequent). Instead, we’ve seen a record number of small to medium flooding events, which our infrastructure and the river’s ecosystems are generally better equipped to handle. The USGS’s stream gauge at Richmond-Westham documented 10 floods in 2018 – again, the most on record. Since 1934, only two other years have seen more than half as many floods as 2018 (see Figure 3). December alone featured three floods – more than most entire years – and not just because of heavy rain. Floods are easier than usual to trigger right now because of absolutely drenched soils, very high groundwater discharge, cool temperatures (less evaporation), and dormant vegetation (less transpiration). The animation below (Figure 4) is a cool visualization of these quick-hitting December floods; watch for crests on Dec 17th, 23rd, and 29th.
Speculation about the effects of this year’s flooding on the ecology of the James River could fill many blog posts, so for this one we’ll stick to the highlights – namely, sediment pollution, nutrient pollution, fish migration, and oysters. For easy navigation I’ve bolded these subjects at the top of the following paragraphs, in case some should be of more interest.
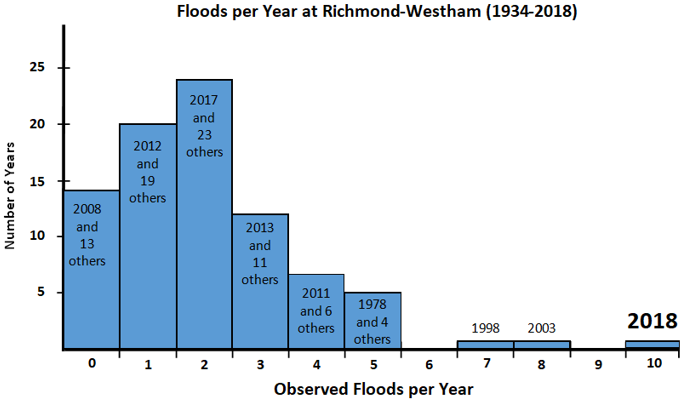
Figure 3. Historical flood frequency at the Richmond-Westham gauge. Data from the United States Geological Survey (USGS).
Sediment pollution is one of the most critical, ongoing challenges facing the James River – an obstacle made worse by hard rains and high water. From the impact of individual raindrops to the scouring force of high streams on bare banks, rainier weather nearly always results in elevated levels of sediment. Dirt may seem pretty innocuous, but over time it can have some serious effects. Smothered underwater grasses, clogged gills, and buried clutches of fish eggs are among the possible consequences. The James River’s underwater grass beds seem to have established a tentative foothold, but they’re very sensitive to changes in environmental conditions. Preliminary assessments in light of this year’s flooding are a mixed bag, with positive signs near the mouth of the Susquehanna and negative ones in the nearby York. The response of the James River’s promising-yet-vulnerable underwater grass beds – which provide vital habitat for many species – will play a major role in determining the long-term effects of this year’s high water.
Nutrient pollution, chiefly in the form of nitrogen and phosphorous, is also intensified by heavy rain. Downpours can scour excess fertilizer and animal waste off agricultural areas and overwhelm cities’ sewage treatment systems.
There is a very tight correlation between the average annual flow of the James River and the associated “load” of nutrient pollution, and while 2018 data are preliminary, this relationship allows us to make an educated guess regarding our annual results. The verdict? 2018’s nutrient pollution loads will almost certainly be among the highest on record. Excess nutrients can lead to algal blooms and oxygen-less dead zones, but here there’s cause for cautious optimism. The reason? For one, a stormier, windier than average summer helped to stir and oxygenate the Bay’s waters, limiting the development of a dead zone in 2018. For another, algal blooms and dead zones are mostly summer phenomena, and conditions may change before warm weather arrives.
Fish migration is more complex, and I’ll limit the discussion to two species: blue catfish and Atlantic sturgeon. Blue cats have taken over the ecosystem of the Lower James but remain relatively scarce in other tributaries to the Chesapeake Bay, partly because the salinity of the Bay usually limits their ability to migrate beyond Hampton Roads. Usually. Wet years and freshwater flooding push that salinity barrier downstream, opening up brief migrational corridors between normally separated tributaries. Effectively, rainfall causes short-term changes to catfishes’ habitat connectivity. Figure 5 shows how this might play out. Technically speaking, it maps blue catfishes’ 72-hour survival rates, expressed as a proportion, based on typical water salinities in wet and dry years. Paraphrased, catfish can move around in the light blue areas but not the red ones. In dry years catfish are stuck well upstream in those disconnected areas of blue, but in wet years survivable conditions connect across the majority of the Chesapeake Bay. As epically wet as 2018 has been, the “wet” scenario shown here is quite possibly an underestimate of catfishes’ current ability to move around.
Sturgeon are a bit of a wild-card. We simply don’t know enough about them. The James River made news this fall as unprecedented levels of sturgeon activity captivated boaters and photographers. Some have proposed a possible link, suggesting that this year’s record-high flows and record-high activity were too synchronous for coincidence. Whether or not this is the case, the new brood must have had a wild ride downstream this year. Aren’t they cute?
Oysters, like submerged grasses, are a bit of a concern. They are resilient to a range of salinities, but this year’s torrents of fresh water likely tested their limits. The most vulnerable oysters beds are furthest upstream, where salinities are usually lowest. For the James, this means the beds just below Hog Island. The Virginia Institute of Marine Science (VIMS), Virginia Marine Resources Commission (VMRC), and other institutions conduct annual surveys of Virginia’s oyster beds. Their researchers will be looking for signs of higher mortality as they process the data this winter, and we’ll be on the lookout for their release. Oysters are also threatened by diseases like MSX, but on the bright side, lower salinity is fatal to the bacteria that cause this disease. Time will tell how these dueling influences counterbalance, and it’s likely we’ll see different effects in different parts of the James River and the Chesapeake Bay.
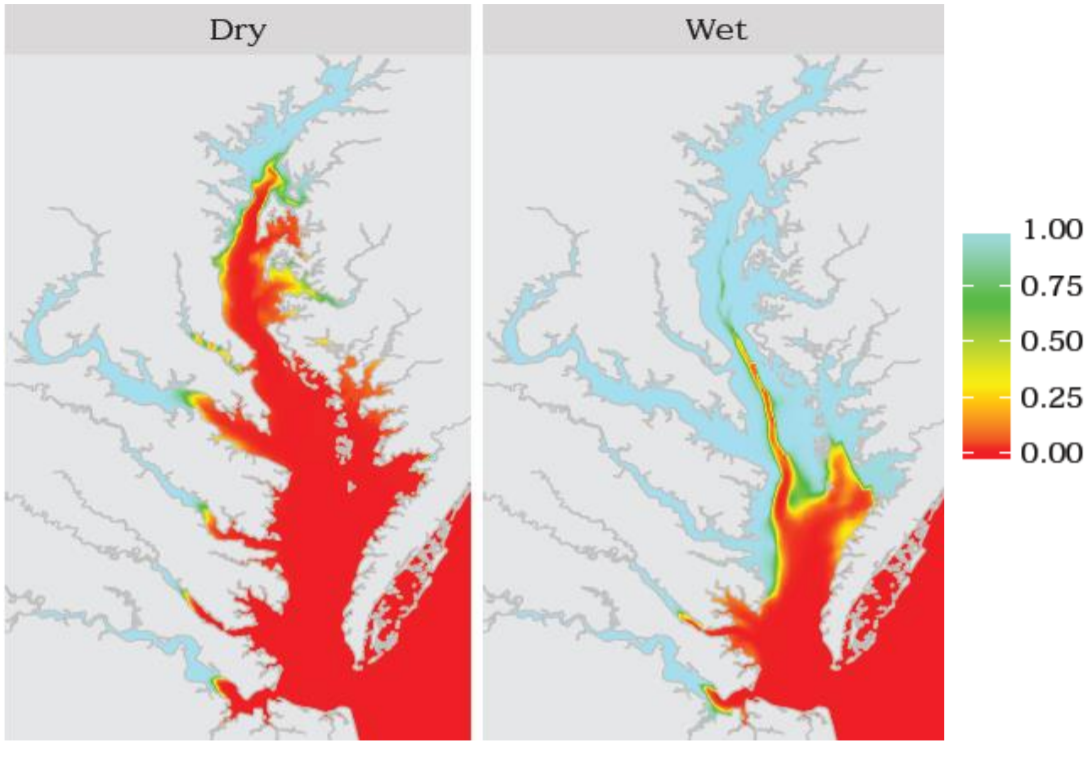
Figure 5. Differences between the 72-hour survival rates of blue catfish in dry (left) vs. wet (right) years. Data from the Virginia Institute of Marine Science.
When the numbers are crunched 2018 will likely be a tougher-than-average year for the James River, but it’s not all doom and gloom. In a longer term sense, the James River is one of America’s most improved waterways. We’ve made leaps and bounds of progress since the river’s low-point in the 1970s, including 10 points of improvement in the last 10 years! Further, floods are a very normal part of river ecosystems – they bring nutrients to the floodplain, recharge the groundwater, and can help expand the habitat of beneficial species. But our conversation would be incomplete if we ignored another piece of the context: this year’s weather happened on an evolving, worsening backdrop of climate change. Today’s warmer air masses are capable of holding more potential rainfall and are more likely to get “stuck” in place, causing extended periods of wet (or dry) conditions, much like we saw in 2018. It’s become a cliché to call extreme weather the “new normal”, except there’s nothing “normal” about it, and over time this will cause significant changes to Virginia’s ecosystems.
To counter this, the new buzzword these days is “resiliency.” The James River Association and many other groups are doing what we can to build riverbanks’ and coastlines’ resiliency to greater and more frequent meteorological extremes. Virginia’s new budget isn’t finalized, but looks great for environment protections. The Northam Administration has taken promising steps in addressing sea level rise. Virginia is partnering with other states to tackle greenhouse gas emissions, build clean energy economies, and combat ocean acidification. There is progress being made, and it’s critical that we maintain this momentum through the 2019 General Assembly and beyond. If you’d like to stay tuned and get involved, come volunteer with us, or sign up for our newsletter or advocacy action network. Thank you for reading, thank you for your support, and here’s to a productive, constructive (and drier) 2019!