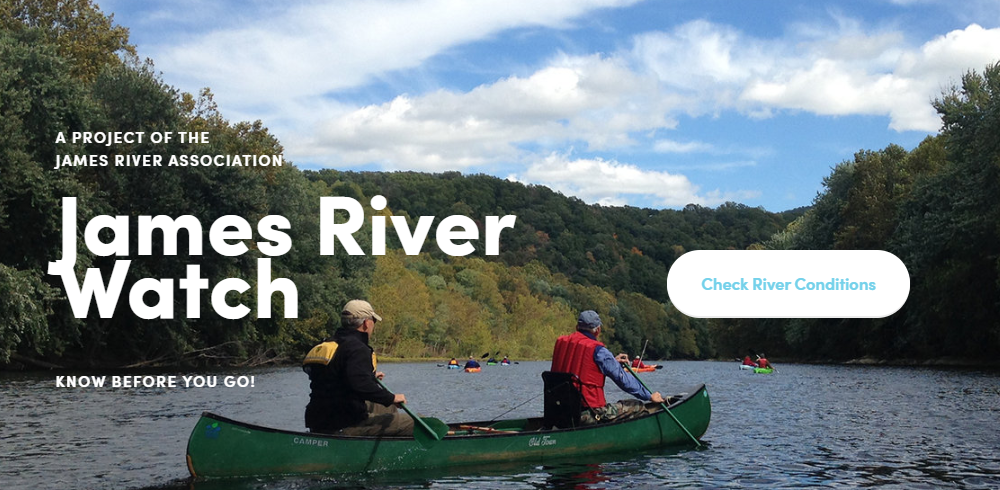
Fall is on the doorstop, school’s back in session, the sturgeon are returning; and thanks to our volunteers, another year of James River Watch is in the books!
Highlights and site-specific stats are summarized below, but we should first acknowledge our volunteers, who make our water quality monitoring program possible. In total, 68 citizen scientists spent 810 hours of their summers collecting 376 bacteria samples at 27 sites across our 10,000-square-mile watershed!
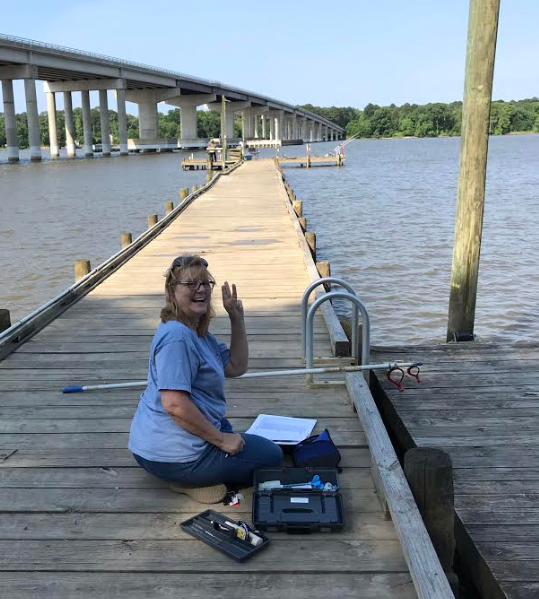
One of our many happy, smiling volunteers!
These hardworking water quality monitors have helped us communicate swimming safety on the James and its tributaries all summer. And this information, in turn, helps us to connect people to the James — a critical component of our mission that our volunteers make possible. We also have many partners to thank — from fellow environmental groups, to outfitters, to local governments, to libraries — who have shared their space and data and strengthened our program and our partnership in the process. So, how were swimming conditions this summer? What do our results show? Let’s dive in.
We’ll start big and work small. Across the watershed this summer, over 90% of our samples showed passing bacteria levels — 5 points higher than our long-term average of 85%, and the highest season average we’ve observed to-date. These positive results were driven by a summer of excellent water quality in the upper and middle portions of the watershed — especially around Richmond and Hopewell, where 2019’s passing rate was frequently 10 to 20 percentage points higher than the historical average. In fact, 18 of our 27 monitoring sites beat their historical averages this year.
But what about the other 9? Interestingly, the most significant underperformers of 2019 are all in the eastern end of the watershed, and this summer’s readings were especially low at Powhatan Creek, Denbigh Boat Ramp, and Deep Creek. These three sites are displayed in yellow on the map below; consult the map and the accompanying table for site-by-site results and trends across the watershed, and to examine water quality near you.
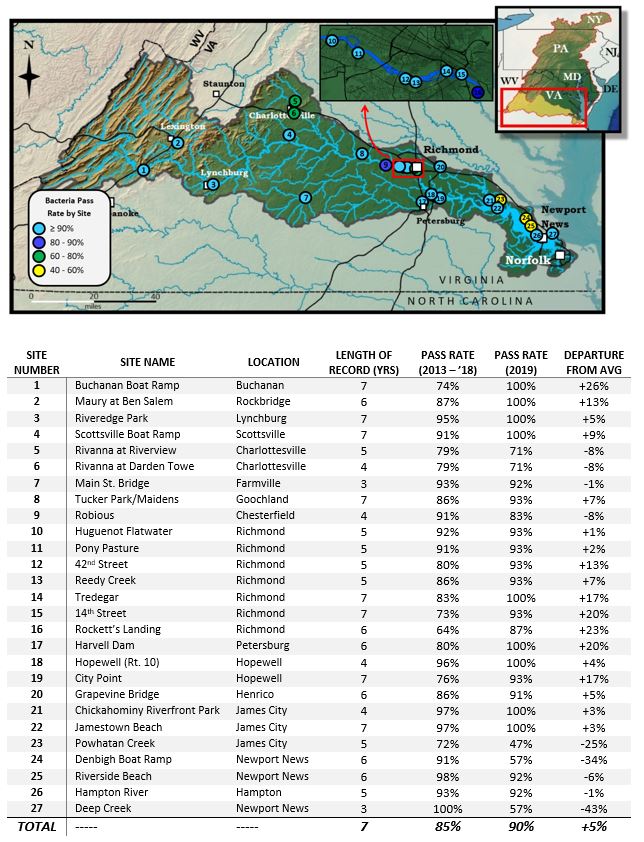
Map and table of site-by-site bacteria monitoring results.
Given this year’s summarized takeaways — that we saw better-than-average water quality across two-thirds of the watershed, especially in Richmond and the Tri-Cities, with a handful of exceptions concentrated on the Lower James — the logical followup question is why. As usual, the largest component of the answer is rainfall. The Middle Atlantic River Forecast Center calculates that the Upper and Middle James have seen about 30% less precipitation than average over the last two months — and to somewhat oversimplify, drier weather means less runoff means less bacteria transported into our waterways. Conversely, this logic also explains why the record-wet weather of 2018 has posed such a setback.
But drier-than-normal conditions don’t tell the whole story. They’re calculated across the entire summer, over months of time, yet much of the variation in bacteria levels is due to short-term timing on the scale of hours and days. As a thought experiment, imagine a localized heavy downpour falling on Wednesday evening. Such an event would likely result in our volunteers collecting a failing sample on Thursday morning, even if the rest of the week was entirely dry. This short-term variation goes to show that rivers are dynamic and complex systems, and they emphasize the driving statement of James River Watch: that it pays to check conditions ahead of time, and to know before you go.
James River Watch’s online website is undergoing changes to address these fluctuating conditions more holistically. If you’ve visited the website recently, you may have noticed that additional layers of information have appeared on the map. These layers, still being tweaked, pull in real-time weather warnings, 3-day precipitation forecasts, and stream gauge data across the watershed. Together, in conjunction with our volunteers’ bacteria data, this additional information provides a complete picture of swimming safety in the James River. We’re very excited for these new upgrades, courtesy of Chesapeake Commons, and the sleek redesign and functional enhancements that they’ve engineered!
Of course, we cannot write off good or bad water quality as nothing more than the whims of the weather. In the long-run, the most significant factor in determining the health of our waterways is us. It’s our actions, and it’s our inactions. And doing your part to clean up the James or your backyard stream can look any number of ways. You can reduce runoff at home by picking up after your pet, or by becoming a River Hero Home. And you can help amplify the conservation community’s voice by signing up for our action network, and by telling your representatives that you support funding for wastewater upgrades, cattle fencing, and other necessary practices to improve our water. Ultimately, a fully recovered James is within our reach, as long as we all step up and do our part!
If you have any questions about the numbers above or are curious to see another breakdown of the data, send me an email! To our volunteers, thank you all once more for your time and your support, and thank you for another great year of James River Watch!